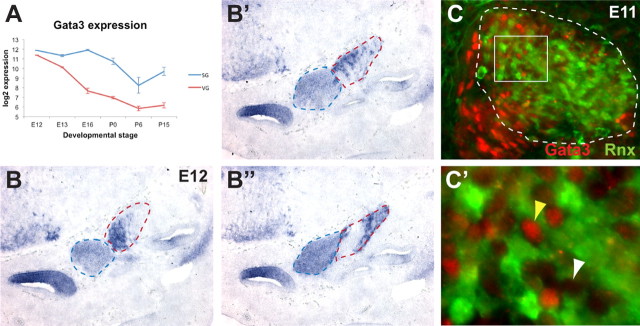
Figure 6.
Dynamic expression patterns of Gata3 in the SG and VG. A, Graph showing microarray expression of Gata3 in the SG and VG, plotted as in Figure 3. At E12, Gata3 is <1.5-fold enriched in the VG. Based on the Affymetrix presence call (data not shown), Gata3 is still present in the VG at E13, but is absent from the VG from E16–P15, while it is present in the SG through P0. B–B″, Multiple sections through a single E12 ear showing in situ hybridization signal for Gata3. Expression is evident in the SG (blue dotted line), but is also strong in a subset of VG cells (red dotted line). C, C′, Gata3 (red) and GFP (green) immunofluorescence in an E11 Rnx-Cre;Z/EG embryo. The VG is indicated by the white dotted line demarcating the GFP-positive region (C). A magnified image of the boxed area in C is shown in C′. Gata3 signal is evident in the nuclei of some GFP-positive cells (yellow arrowhead), but not of other GFP-positive cells (white arrowhead), indicating that Gata3 is expressed in a subset of VG neurons (C′).

