Figure 1.
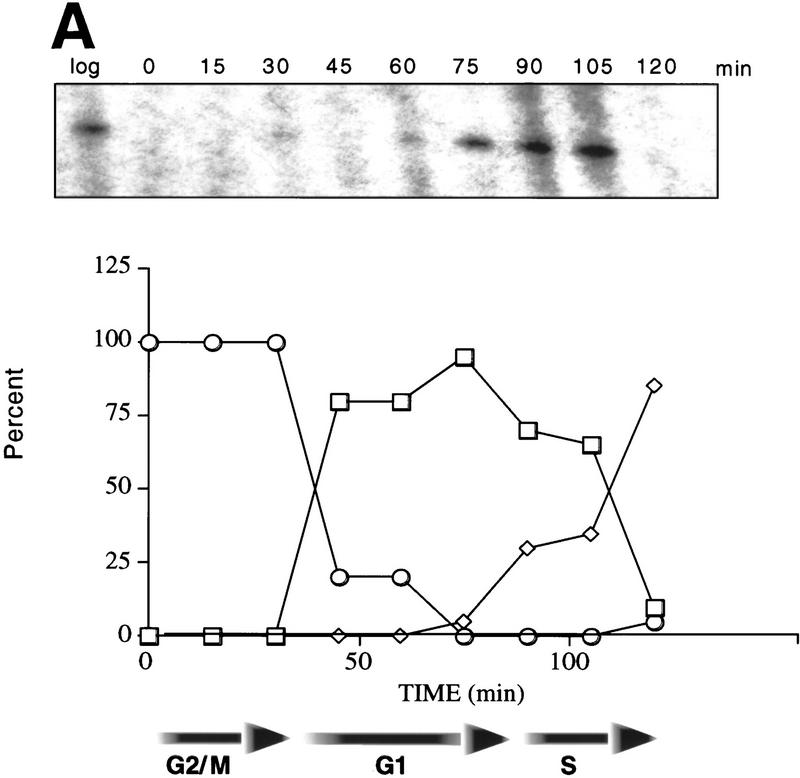
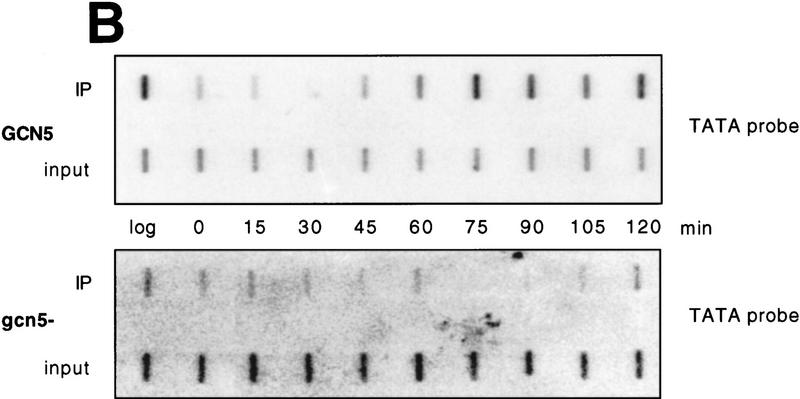
Nucleosomes at the TATA region of HO are subject to GCN5-dependent, transient acetylation prior to transcription. (A) Budding index and primer extension analysis of HO transcripts show the cell cycle-dependence of HO expression. Cells were arrested in G2/M by treatment with nocodazole, as described in Materials and Methods. Percentages of cells with no buds (□) (G1), small buds (⋄) (S phase), or large buds (○) (G2/M) were determined at the times shown after release from nocodazole arrest. Samples were taken from these timepoints for either RNA analysis or for ChIPs (see below). HO transcripts are detectable by primer extension in late G1 and peak at the onset of S phase (appearance of small buds; 90–105 min in wild-type cells). (B) Results of ChIP assays for either wild-type or gcn5- cells. Chromatin obtained from cells released from nocodazole arrest as described above was immunoprecipitated with antibodies that recognize histone H3 acetylated at positions 9 and 14 (αH3ac.9/14). DNA obtained from either input or immunoprecipitated material was applied to slot blots. Representative slot blots probed for the HO TATA region are shown. (C) Quantitation of representative slot blots. Blots were quantitated with a PhosphorImager; the results are expressed as the ratio of the bound to the input material (IP efficiency). The graph at left shows the results for the HO TATA probe for either GCN5+ or gcn5− cells, showing the GCN5-dependent peak of acetylation between 60 and 90 min after release from nocodazole arrest. The high levels of acetylation detected in log phase cells, as well as in early S phase, are also partially GCN5 dependent. The middle graph depicts the global levels of GCN5-dependent acetylation using the genomic DNA probe, and acetylation detected by the rDNA probe is shown at right. The log- and early S-phase levels of acetylation are high in both total DNA and rDNA, but the late-G1 peak is specific to HO. Data shown are representative of four separate experiments with ChIP extracts from two independent cell synchronizations. (D) ChIP analysis of the wild-type samples from C using antibodies against unacetylated H3. The smaller scale on this graph reflects the weaker IP efficiency of these antibodies. (E) ChIP analysis of wild-type and gcn5- cells with antibodies recognizing hyperacetylated histone H4. (Solid bars) Gcn5p; (open bars) gcn5.


