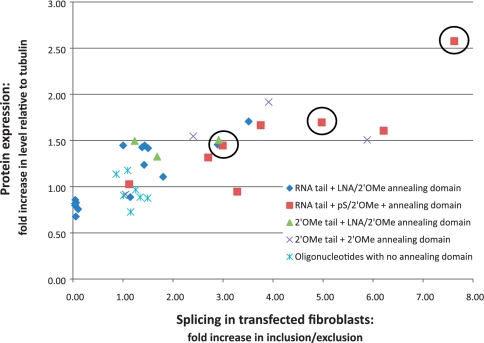
Figure 3.
Comparison of the activities of bifunctional oligonucleotides on SMN protein expression and splicing in transfected SMA fibroblasts. The level of SMN protein expression relative to that of tubulin, and expressed relative to the corresponding level in untransfected cells, is plotted against the ratios of the mRNA isoforms determined by real-time PCR. As in Figure 3, the results are derived from experiments with the oligonucleotides at 250 nM, and they are grouped according to the chemistries of the oligonucleotides used. The results for oligonucleotides 6, 3 and 1 (left to right) have been circled.

