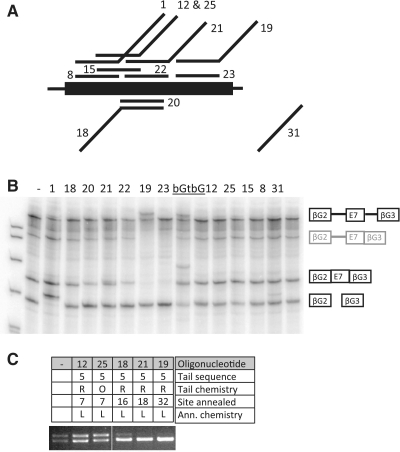
Figure 6.
Effects of the site of annealing on the efficiency of TOES oligonucleotides. (A) Diagram showing the positions of annealing of the oligonucleotides to exon 7. Numbers are the designations of the oligonucleotides. Oligonucleotides 1 and 8 anneal to exon 7 positions 2–16, 18 and 20 to 16–30, 21 and 22 to 18–32, 19 and 23 to 32–46, and 12, 25 and 15 to 7–21. Of these, oligonucleotides 8, 20, 22, 23 and 15 lack tails. (B) In vitro splicing assays with the oligoribonucleotides shown above the lanes. The oligonucleotides labelled as bGt and bG are complementary to β-globin exon 2; bG lacks a tail. The diagrams on the right show the pre-mRNA and the two mRNA product isoforms; the diagrams in grey show intermediates. As noted for Figure 6, the presence of the RNA in which intron 2 has been spliced is an indication of use of the inclusion pathway of splicing. The bands above the pre-mRNA in lanes 19 and bGt, and above the inclusion mRNA in bGt, result from persistent annealing of the oligonucleotide in the denaturing gel. This is a feature of the oligonucleotides in which the annealing portion contains LNA/2′-O-methyl analogues and 40% or more (G+C). (C) Qualitative RT–PCR analysing splicing of endogenous SMN2 in fibroblasts transfected with some of the same oligonucleotides.

