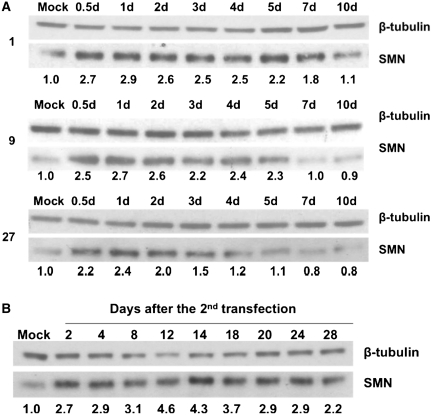
Figure 9.
Time course of SMN protein expression after transfection with oligonucleotides 1, 9 and 27. (A) SMA fibroblasts were transfected and samples taken at the intervals shown (d, days) for analysis by western blotting. (B) Persistence of elevated SMN protein levels after a second transfection with oligonucleotide 1. SMA fibroblasts were transfected and then re-transfected after 5 days. Samples were taken at the number of days indicated after the second transfection and analysed by western blotting. Numbers under the lanes indicate the fold increases in the ratio of SMN to tubulin protein.

