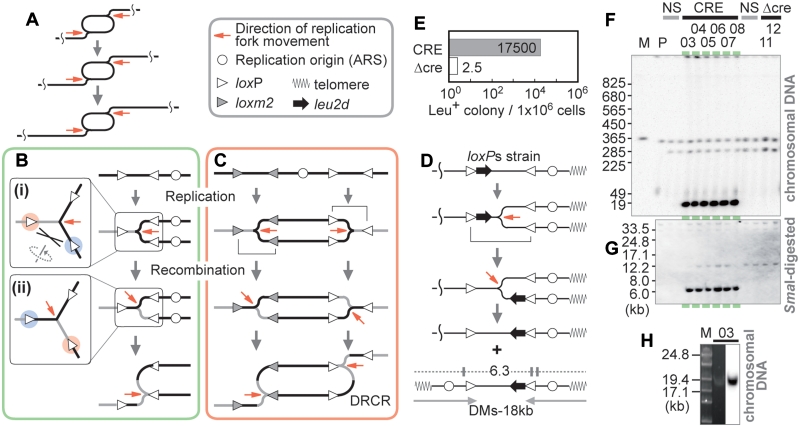
Figure 1.
Recombinational process coupled with replication. (A) DRCR. Two replication forks chase each other. One replication fork can replicate a template for the other fork and so amplification proceeds. (B) Recombinational process coupled with replication. The gray and black lines indicate the un-replicated and recently replicated regions at the time of recombination, respectively. If recombination occurs between loxP sites marked red and blue (i), the replication template is switched and thereafter the replicated region is replicated again (ii). (C) DRCR induction. If both bidirectional DNA replications undergo the processes as described in (B), DRCR can be induced. (D) Structure of the loxPs cassette, a model for the production of the minichromosome, and the predicted structure of the 18 kb DM-type products. The SmaI sites (vertical lines), and the sizes (kb) of fragments that hybridize with the leu2d probe are shown. The gray arrows below indicate an inverted structure. (E) Frequency of Leu+ colony formation. The colonies were counted as described in Materials and Methods of Supplementary Data. CRE: Cre-induced condition; Δcre: negative control. (F) Southern analysis of a representative sample of survivors with the leu2d probe. PFGE and Southern analysis were performed as described in Materials and Methods of Supplementary Data. The colony numbers are indicated above. M: Saccharomyces cerevisiae marker; P: the parental strain (LS20); NS: non-selective conditions. (G) Southern analysis of SmaI-digested DNA of the samples from (F) with the leu2d probe. (H) SYBR Green I staining and Southern analysis of the samples from colony #03 by PFGE for lower range.

