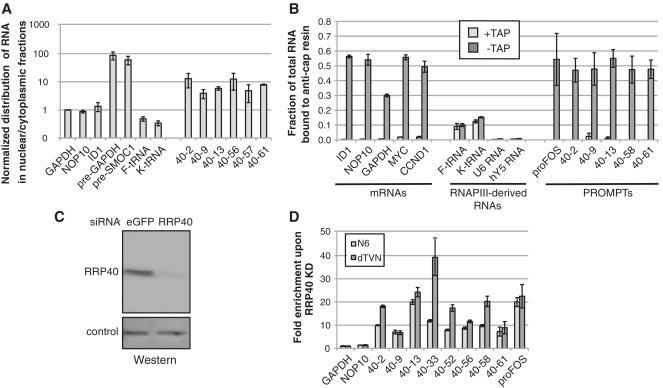
Figure 1.
Biochemical characterization of PROMPTs. (A) PROMPTs are nuclear. RNA was prepared from cytoplasmic and nuclear fractions of HeLa cells and quantified by RT–qPCR. The nuclear/cytoplasmic ratios of the indicated PROMPT levels were normalized to that of GAPDH mRNA (the qPCR primers for the GAPDH amplicon span several exons) and are shown on a logarithmic scale. NOP10 and ID1 are additional mRNAs. As positive and negative controls for nuclear enrichment two pre-mRNAs and two tRNAs were used. Error bars show standard deviations of triplicate technical replica of a representative experiment. (B) PROMPTs are capped to the same level as mRNAs. Total RNA from HeLa cells was treated with (‘+TAP’) or without (‘−TAP’), tobacco acid pyrophophatase prior to IP using the K121 anti-cap antibody. Antibody-bound and -unbound (supernatant) fractions were analyzed by RT–qPCR for their relative amounts of various mRNAs, RNAPIII-derived RNAs and PROMPTs (‘40–2’ etc) as indicated. The fraction of the total (bound plus unbound) RNA bound to the antibody was determined (see ‘Materials and Methods’ section) and is plotted with error bars showing standard deviations of triplicate technical replica of a representative experiment. (C) Western blotting analysis confirming KD of RRP40. Equal amounts of protein extracts prepared from HeLa cells, transfected with either a control (eGFP) or a RRP40 siRNA, were separated by SDS–PAGE and transferred to membrane. The blot was probed with a polyclonal anti-RRP40 antibody. The loading control shows a cross-reacting band with different electrophoretic mobility. (D) The 3′-adenylation extent of PROMPTs upon exosome depletion. Total RNA from RRP40 KD and control HeLa cells was reverse-transcribed with either a random hexamer primer (‘N6’) or an anchored oligo-dT primer (‘dTVN’) and the increases of the indicated PROMPT levels upon RRP40 KD were determined by qPCR. GAPDH and NOP10 RNAs were included as controls. Error bars show standard deviations of triplicate technical replica of a representative experiment.

