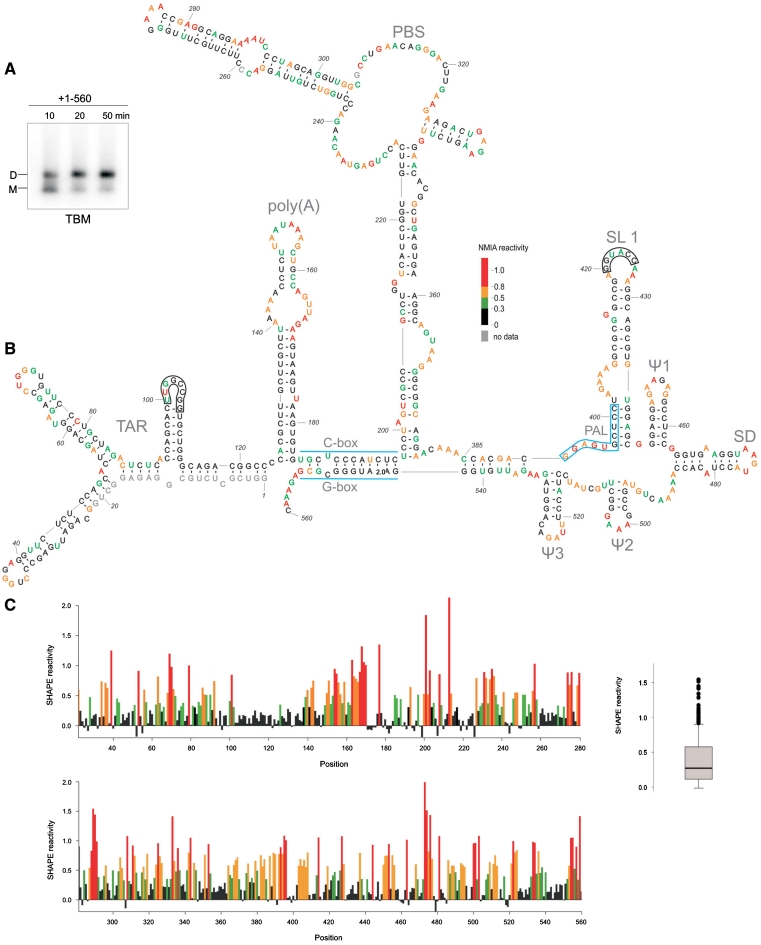
Figure 2.
(A) Analysis of the loose dimer formation by the HIV-2 leader RNA (+1–560) in the SHAPE buffers and folding conditions (TBM agarose gel). (B) Secondary-structure model of the HIV-2 leader RNA captured in the loose dimer form. Two kissing-loop interfaces are indicated as black frames. Nucleotide residues accessibilities to NMIA are given in colours and according to scale. (C) Processed SHAPE reactivities as a function of nucleotide position. Red and orange bars reflect reactive positions in the RNA. Insert on the right represents the box plot analysis of distinct reactivity distributions for the HIV-2 leader RNA. Box outline middle 50% of dataset; the median is shown with heavy line. Circles indicate extreme values (7): 1.5 times the interquartile range (boxed). Horizontal lines above and below the box are the largest or smallest non-outlier values.

