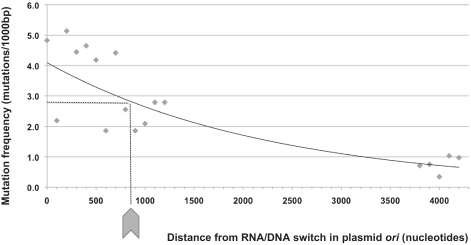
Figure 2.
Pol I mutation frequency as a function of distance from RNA/DNA switch. Mutation frequency (expressed as number of mutations per 1000 bp) for the hTK library generated following seven rounds of pol I mutagenesis. The x-axis is the distance (in nucleotides) from the ori RNA/DNA switch. Each point represents a 100-bp interval. The trend line shown represents an optimized exponential fit (r2 = 0.79).

