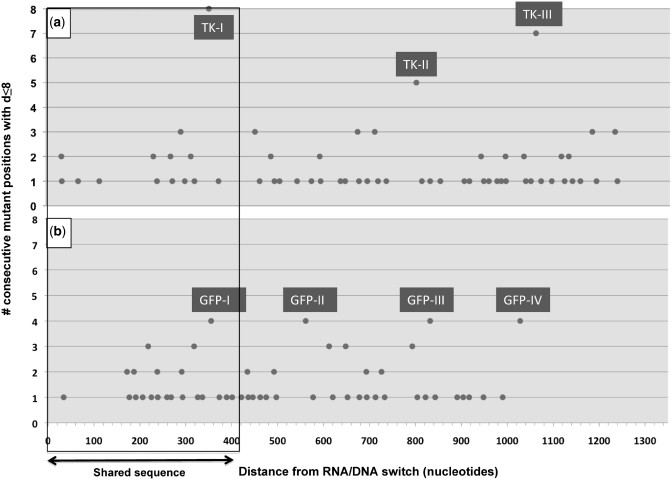
Figure 5.
Clustering analysis for marker lagging-strand mutations. Number of consecutive positions with marker lagging-strand mutations that can be found at a distance of ≤8 nt from each other (y-axis) relative to the distance (in nucleotides) of mutant positions from the RNA/DNA switch (x-axis). The portion of sequence shared between the two libraries is boxed. Clusters considered significant (n > 3 mutations) are labeled TKI-III (hTK library) and GFP I–IV (GFP library). (a) hTK library, generated through 5–7 rounds of pol I mutagenesis, and with an average distance between marker lagging-strand mutations (for the interval shown) of 15.9 nt. (b) GFP library, generated through 1–2 rounds of pol I mutagenesis, and with an average distance between marker lagging-strand mutations (for the interval shown) of 15.3 nt.

