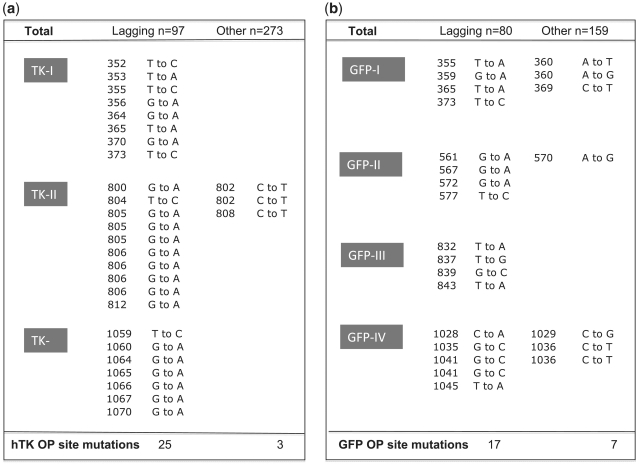
Figure 6.
Mutation spectrum within clusters. Listed are the point mutations found in the clusters defined in Figure 5 as putative OP sites. The sequenced strand was the leading strand. Each cluster is labeled, with hTK clusters (TK-I, TK-II and TK-III) shown on the left (a) and GFP clusters (GFP-I, GFP-II, GFP-III and GFP-IV) shown on the right (b). For each library, marker lagging-strand mutations are listed on the left, and their complement on the right. For each mutation, the mutant position relative to the RNA/DNA switch and observed nucleotide substitutions are listed. The reference sequences for the hTK and GFP plasmids can be found in Supplementary Figure S1. Note that the total number of marker lagging-strand mutations listed (n = 42) exceeds the total number of positions shown in Figure 5 within n > 3 clusters (n = 37). This is due to the fact that three positions (804 and 805 of hTK library and 1041 of the GFP library) had more than one mutation.

