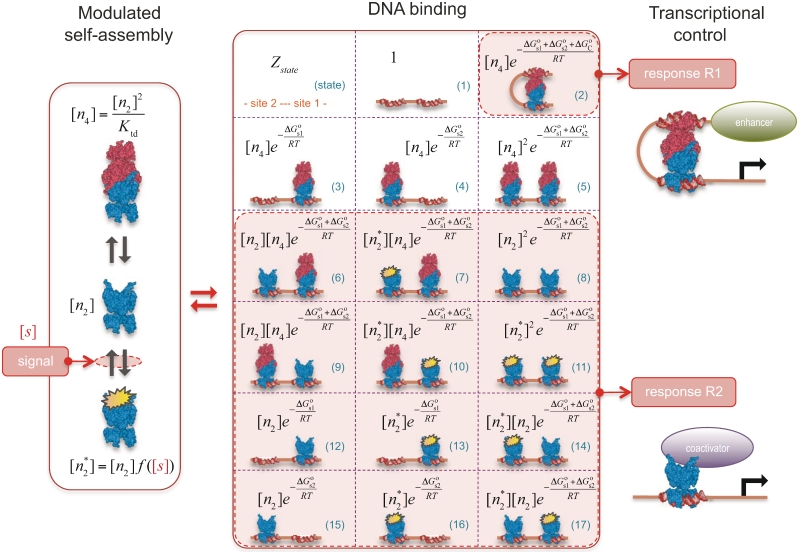
Figure 1.
Quantitative modeling of control of gene expression by modulated self-assembly. Intracellular signals are processed through ‘Modulated self-assembly’ into populations of different oligomeric species that upon ‘DNA binding’ engage in ‘Transcriptional control’. Modulated self-assembly: the intensity of a self-assembly modulator signal  , e.g. ligand or active kinase concentration, regulates the formation of high order oligomers by modifying (represented as a yellow spark) the low order oligomers and preventing their self-assembly into the high order species. DNA binding: the oligomeric species bound to DNA (in orange/red) are described by their free energies with the statistical weights (
 ) shown for each binding state (expression in black). The parenthesized number, in blue, labels each of the 17 states and the molecular representations illustrate the binding combinations of the transcriptional regulator to the two DNA sites (site 1 and site 2). The top left box summarizes the notation. Transcriptional control: one state (state 2) can trigger response R1, in which an enhancer is positioned in the vicinity of the promoter region, and twelve states (states 6–17) can potentially trigger response R2, in which a coactivator is recruited to the promoter region. Dimers and tetramers have been drawn as compositions of the nuclear hormone receptor RXR structures from the PDB files 1BY4 (DNA binding domains bound to the two half-sites on DNA, or RXR response elements) and 1G1U (ligand binding domains).

