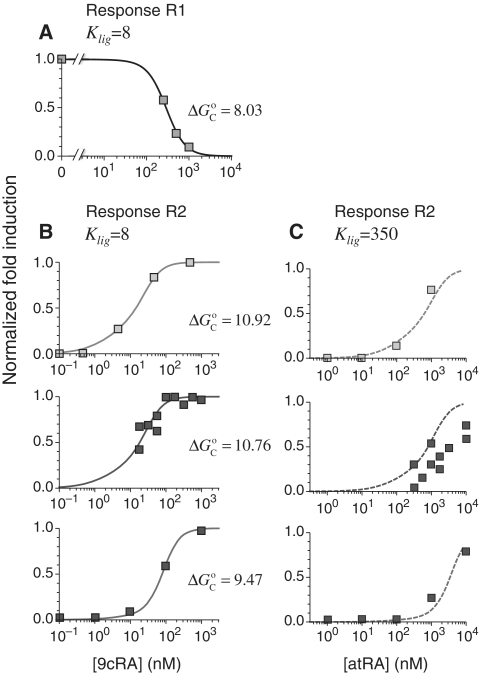
Figure 2.
Prediction of RXR-mediated transcriptional responses to 9cRA and atRA ligands. The results of the model (lines) for the functional regime are compared to the normalized fold induction (NFI) from experimental data (symbols) for different promoters and ligands. The model uses the experimental values  for 9cRA (52) or
  for atRA (53), and
  (7). The conformational free energy
  (shown in kcal/mol) is inferred from just the experimental data for 9cRA by minimizing the mean squared error between model and experiments and the resulting value is used subsequently for responses to atRA. (A) Response to 9cRA for a system with two separated DNA binding sites for RXR and a distal enhancer. Experimental gene expression data is taken from Figure 5b of Yasmin et al. (16), which used COS-7 cells transfected with the reporter, consisting of double RXRE and a UAS site 300-bp upstream, in a vector encoding GAL4-VP16. The NFI was computed as
  (see Supplementary Data) with Equations (2) and (3). In this case, the half-maximum response concentration, or EC50, is about 35 times higher than the 9cRA–RXR dissociation constant. (B) Responses to 9cRA for systems with contiguous DNA binding sites for RXR. The variability of the dose–response curves, including 10-fold changes in the EC50 and different slopes, is accurately captured by the model by just adjusting
  . The three different curves correspond to three different experimental systems, reported in Figure 5a of Heyman et al. (40) (top), which used S2 cells cotransfected with the expression plasmid A5C-hRXRα and the reporter plasmid ADH-CRBPII-LUC; Figure 4b of Levin et al. (41) (center), which used CV-1 cells cotransfected with the reporter CRBPII-RXRE-CAT construct and plasmid RXRα; and Figure 5b of Heyman et al. (40) (bottom), which used CV-1 cells cotransfected with the expression plasmid pRSh-RXRα and the reporter plasmid TK-CRBPII-LUC. The NFI was computed as
  (see Supplementary Data) with Equations (2) and (3). (C) Responses to atRA for systems with contiguous DNA binding sites for RXR. The three different dose–response curves correspond to the three systems of Figure 2B with the all-trans retinoic acid (atRA) as ligand of RXR instead of 9cRA. The highly variable dose–response curves are fully predicted without free parameters using the values of
  inferred in Figure 2B.

