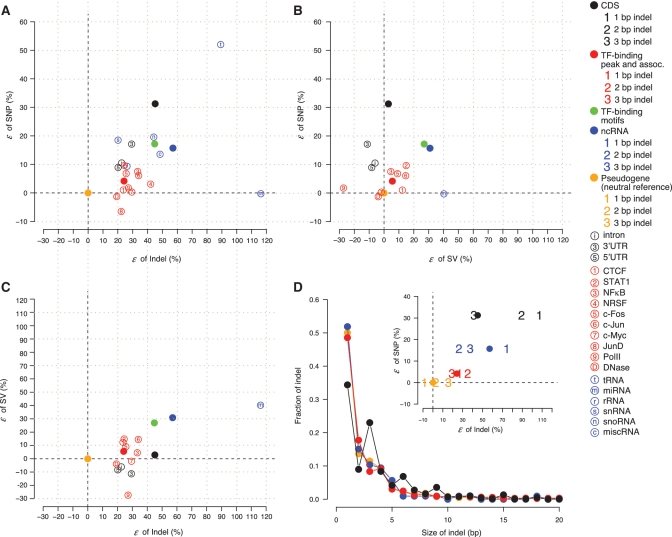
Figure 4.
Comparison of the excess of low-frequency variants, ε, relative to a neutral reference between (A) SNPs and indels, (B) SNPs and SVs and (C) SVs and indels. (D) Size distribution of indels up to 20 bp in the genomic elements. A tri-nucleotide periodicity for indels in CDSs is shown. The inset shows ε for indels of size 1–3 bp. Digits ‘1’, ‘2’, and ‘3’, respectively, represent 1, 2 and 3 bp indels. The solid circles represent the overall ε of SNPs and indels for a class of elements. Black dashed lines in A–D represent ε = 0. SNP and indel allele frequencies are shown for CEU, and SV allele frequencies represent the average of the three populations. Elements with fewer than five variants for the corresponding variation type are not shown.

