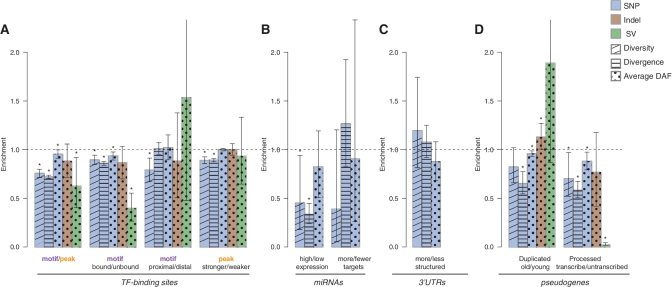
Figure 5.
Comparison of the SNP diversity, divergence and DAF of three types of variations between subclasses of elements with different genomic features. The elements shown include (A) TF-binding sites, (B) miRNAs, (C) 3′-UTRs, and (D) pseudogenes. Feature annotations for the first and second subclasses of each element are separated by a slash in the legends below each bar. The height of each bar represents the bootstrapping mean of the ratio of the corresponding measures in the first subclass to the second subclass (Supplementary Data). The dashed line represents a same level of measurement between the two subclasses. Error bars represents the 95% confidence interval (CI) obtained from the empirical distribution of bootstrapping. The asterisks denote a significant difference in the corresponding measure between the two subclasses of elements (i.e. bootstrapping mean not included in the 95% CI). SNP diversity and divergence are calculated for each region in a subclass of elements (‘Materials and Methods’ section). DAF is obtained from the variants in the union of the regions (no double counting for overlapping regions). The SV allele frequencies shown are the average of the three populations and the other measures are shown for CEU. Element subclasses with fewer than four variants for the corresponding variation type are not shown.

