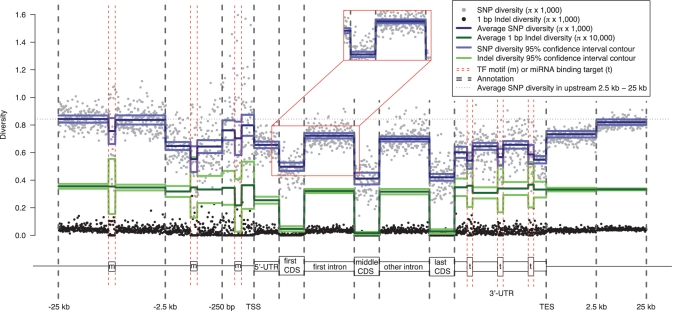
Figure 6.
Aggregation of nucleotide diversity across protein-coding genes and the surrounding regions. Each data point represents the average diversity in a certain bin across all the sequences of an annotation (Supplementary Data). The number of bins within an annotation is constant for all sequences. Solid lines represent bootstrapping means and 95% confidence intervals from the block bootstrapping procedure (‘Materials and Methods’ section). Note that the solid lines for 1-bp indel diversity are scaled by a multiple of 10 relative to the other measures in the aggregation plot (see the legend at the top right corner of the plot). Red boxes compare a section of the aggregation plot produced from the block bootstrapping procedure (main figure) to the simple bootstrapping procedure (the blow-out section, see full plot in Supplementary Figure S7), and show an underestimation of the standard deviation using simple bootstrapping. TSS, transcription start site. TES, transcription end site. m, TF-binding motif. t, miRNA binding target. Data is shown for CEU.

