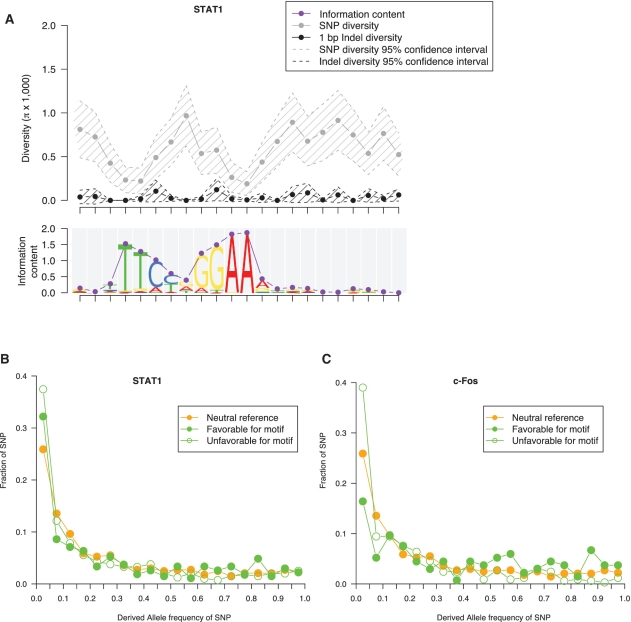
Figure 7.
(A) Aggregation of nucleotide diversity across STAT1 motifs. Each data point represents the average diversity at a nucleotide position across all the sequences of the motif (Supplementary Data). The sequence logo of STAT1 motifs is shown at the bottom. The height of the sequence logo at each nucleotide position corresponds to the information content. (B) Derived allele frequency spectrum for the SNPs favorable and unfavorable to the STAT1 motif. (C) Derived allele frequency spectrum for the SNPs favorable and unfavorable to the c-Fos motif. Data is shown for CEU.

