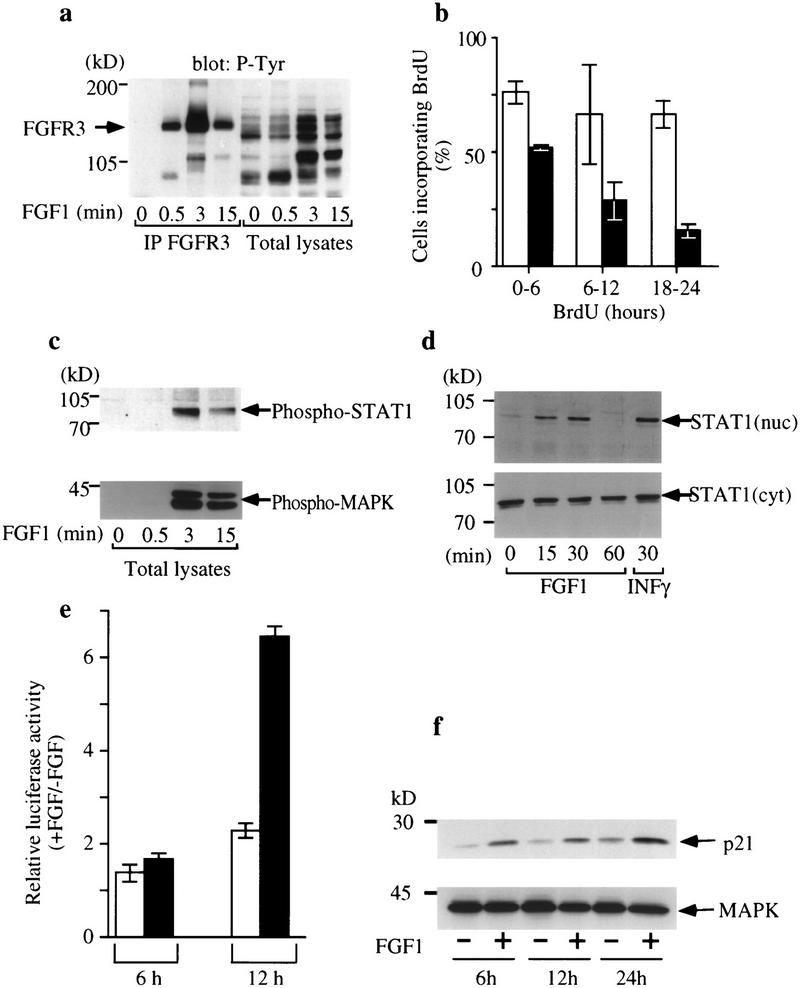
Figure 1.
Activation of FGFR3 phosphorylates STAT-1 and inhibits RCS proliferation. (a) Immunoprecipitation of FGFR3 (IP FGFR3) from RCS cells untreated (0) or treated with 100 ng/ml FGF1 (0.5, 3, 15 min) followed by Western blotting with phosphotyrosine antibody 4G10. (b) RCS cells were incubated in the presence (█) or absence (□) of FGF1 (10 ng/ml) and labeled with BrdU for the times indicated after FGF addition. Each histogram represents the average of three experiments; error bars represent s.d.. (c) RCS cells were stimulated with FGF1 (100 ng/ml) and phosphorylation of STAT-1 (α-phospho-STAT-1, top) and MAPK (α-phospho-MAP kinase, bottom) was determined by Western blotting. (d) Translocation of STAT-1 to the nucleus of RCS cells following FGF stimulation. Cells were treated with FGF1 (100 ng/ml) for the times indicated and fractionated into nuclear and cytoplasmic fractions, which were subjected to SDS-PAGE and Western blotted with anti-STAT-1 antibodies. INFγ was used as control for STAT-1 nuclear translocation (top). (e) Expression of an IRF promoter-driven plasmid is up-regulated by FGF in RCS cells. Cells were transfected with 0.4 μg/106 cells of a plasmid expressing the luciferase gene under the control of the tk promoter and four copies of the STAT-1 binding sequences derived from the IRF-1 promoter (█) or with the same plasmid lacking the IRF-1-derived elements (□). The histograms represent the ratio of luciferase activity between cells treated with FGF1 (10 ng/ml) and untreated cells. FGF was added for the indicated times after washing of the calcium–phosphate/DNA precipitate. (f) Protein levels of p21WAF1/CIP1 protein increase upon treatment with 10 ng/ml FGF1 for 6, 12, and 24 hr (top). Western blotting of the same cell lysates with αERK2 antibody (bottom) was used as a control for the amount of protein loading.

