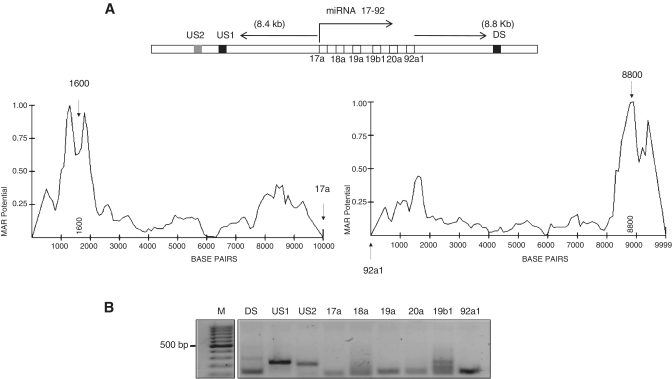
Figure 3.
MARs influence miRNA clusters. (A) Schematic representation of miRNA 17–92 cluster and the flanking 10 kb regions. The dark boxes represent conserved MAR elements (US1 and DS), boxes in white the individual miRNA genes and the shaded box a control region upstream of the MAR element (US2). The graph below depicts the MAR potential of the individual MAR element present upstream and downstream of the miRNA 17–92 cluster, with the arrows pointing the region of maximum peak potential. (B) Amplification of the MAR elements and the individual miRNA genes from the genomic DNA of IMR-32 cells.

