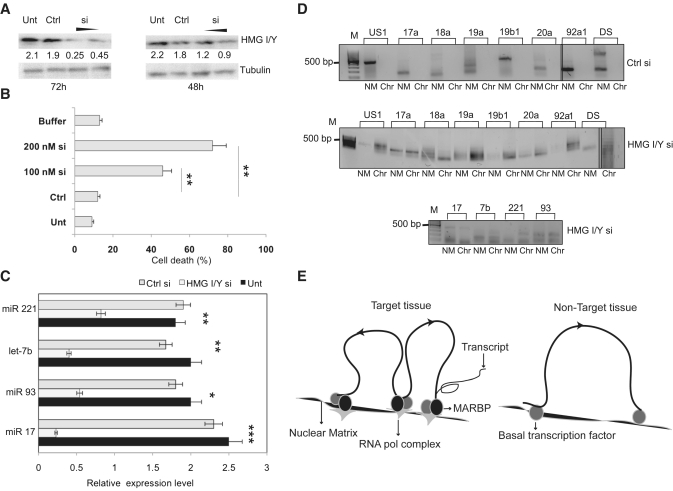
Figure 6.
HMG I/Y regulates the miRNA gene partitioning. (A) Immunoblot analysis for HMG I/Y after partial knockdown using 100 and 200 nM siRNA, compared with siRNA control (Ctrl) and untreated cells, after 72 h and 48 h of transfection. Tubulin was used as loading control. (B) Quantification of cell death by trypan blue exclusion assay by transfection of HMG I/Y using 100 nM or 200 nM siRNA or Ctrl in IMR-32 cells after 72 h. Results are means of three independent experiments ± SD. (C) Quantitation of the levels of the indicated miRNAs in untreated cells IMR-32 cells (Unt) and after 48 h of siRNA mediated HMG I/Y knockdown (HMG I/Y si) using real-time RT–PCR analysis. The expression levels were normalized using 5s rRNA as internal control. A control siRNA (Ctrl si) was used as negative control. Statistical comparisons were done using Students t-test. *indicates P < 0.05, **P < 0.01, ***P < 0.001. (D) The NM and chromatin fractions from IMR-32 untreated control cells or HMG I/Y siRNA transfected cells were used to amplify the miRNA 17-92 gene cluster (panel above) and the MAR elements of indicated miRNAs (panel below). (E) Schematic representation of cis-regulation of miRNA expression by NM–loop organization in target and non-target tissues. In the target tissue (left panel) transcription is facilitated by attachment of MARs to the NM by specific MARBPs like HMG I/Y. This regulates expression by bringing the miRNA genes to the close proximity of transcription factories containing RNA polymerase and other components of the transcription apparatus. In non-target tissues/cells, MARs flanking the genes are not bound to the matrix due to absence of specific MARBPs preventing the gene/locus from associating with the focal points of high transcriptional activity.

