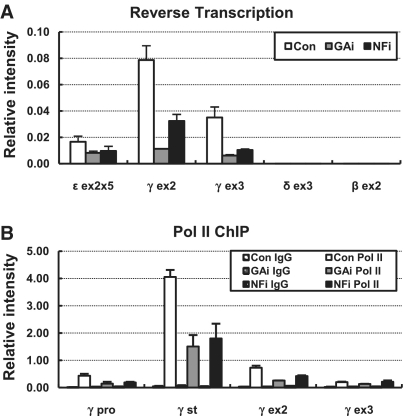
Figure 2.
Transcription of the globin genes in GATA-1 or p45/NF-E2 knockdown K562 cells. (A) cDNA was prepared from RNA isolated from K562 expressing each shRNA and then amplified by real-time PCR using primers and probes for exons of the ε-, γ-, δ- and β-globin genes. Transcript levels of the globin genes were compared to transcript levels of the Actin control gene. The level of the ε-globin gene was multiplied by five to show changes in the knockdown cells. The results of two to four independent experiments ± SEM are graphed. (B) ChIP was performed with antibody specific to RNA polymerase II in K562 cells expressing each shRNA. Relative intensity was determined by quantitatively comparing immunoprecipitated DNA with input for the indicated γ-globin gene amplicons and then normalizing to the intensity at the Actin. Normal rabbit IgG (Con IgG) served as experimental control. The results of two to four independent experiments ± SEM are graphed.

