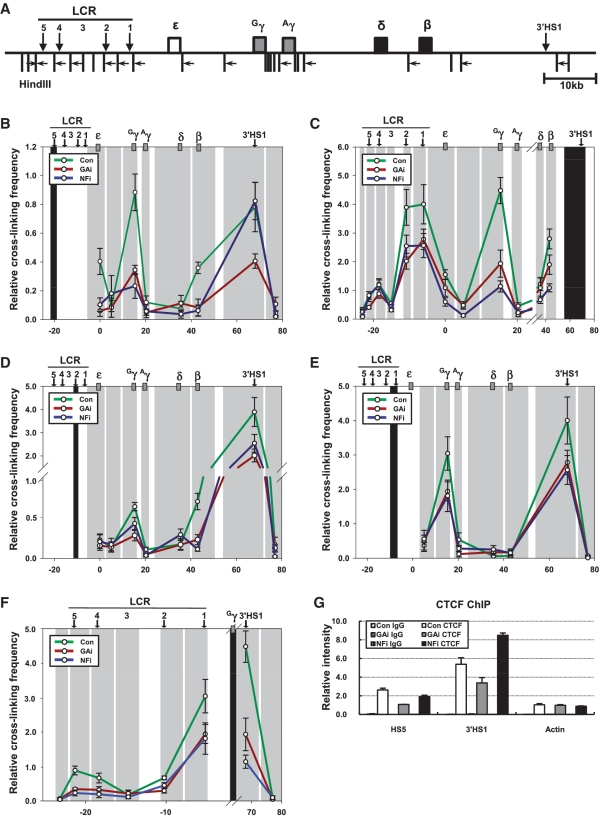
Figure 5.
Relative proximity between HSs and the γ-globin gene in the β-globin locus in the GATA-1 or p45/NF-E2 knockdown cells. The 3C assay was performed with HindIII restriction enzyme. (A) HindIII sites and PCR primers in the β-globin locus were represented by vertical bars and horizontal arrows, respectively. The black shading represents the anchor fragment for HS5 (B). 3′HS1 (C). HS2 (D). HS1 (E) and Gγ-globin gene (F) in PCR. The gray shadings are fragments generated by HindIII digestion. Relative cross-linking frequency was determined by quantitatively comparing ligated DNA in cross-linked chromatin with control DNA and then normalizing to the cross-linking frequency at the ERCC gene. The results are averages of four to six independent experiments ± SEM. (G) ChIP was performed using CTCF antibody described in Figure 1.

