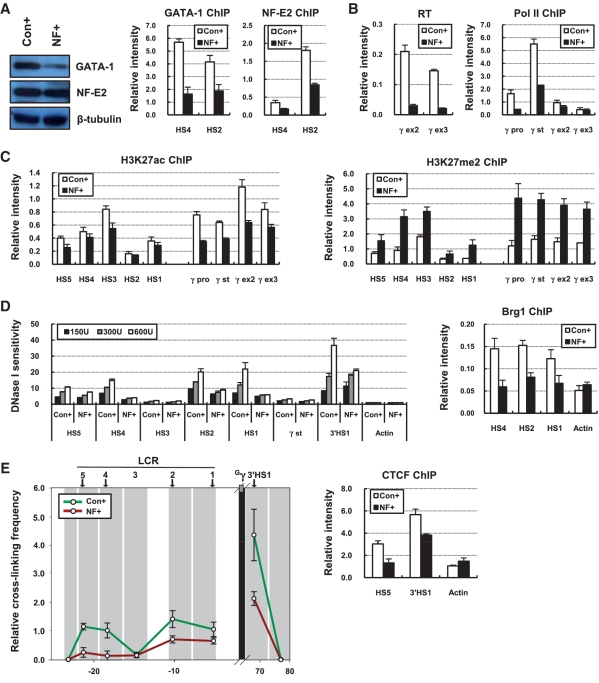
Figure 6.
Chromatin structure in the GATA-1 knockdown cells with restoration of p45/NF-E2 protein. (A) Western blotting was performed using antibodies specific to GATA-1 or p45/NF-E2 in protein extract from K562 cells where co-transduction of control shRNA and control expression vector (Con+) or co-transduction of GATA-1 shRNA and p45/NF-E2 cDNA expression vector (NF+) was performed. ChIP was performed with GATA-1 or p45/NF-E2 antibodies in Con+ and NF+ cells and analyzed as described in Figure 1. (B) RT–PCR and ChIP using antibody specific RNA polymerase II were performed in Con+ and NF+ cells and analyzed as described in Figure 2. (C) ChIP was performed with antibodies specific to H3K27ac and H3K27me2 in Con+ and NF+ cells and analyzed as described in Figure 2. (D) DNase I sensitivity was measured in Con+ and NF+ cells as described in Figure 4 and ChIP was performed with Brg1 antibody and analyzed as described in Figure 1. (E) The 3C assay was performed with HindIII restriction enzyme in Con+ and NF+ cells and fragment containing the Gγ-globin gene was used as anchor. Relative cross-linking frequency was determined as described in Figure 5. ChIP was performed with CTCF antibody and analyzed as described in Figure 1.

