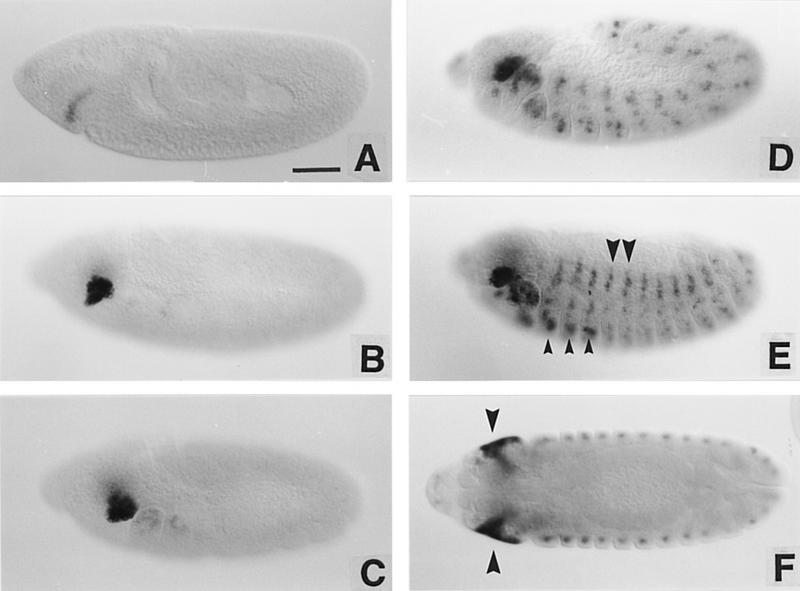
Figure 5.
ss transcript distribution in embryos. (A– E) The pattern of ss transcript distribution beginning at stage 8 and continuing through late embryogenesis. Small arrowheads in E indicate the leg anlage; large arrowheads indicate expression in the peripheral nervous system. In F, an optical section midway through a germ-band retracted embryo shows the extent of expression in the invaginating eye–antennal discs (arrowheads). Scale bar, 50 μm.

