
Figure 6.
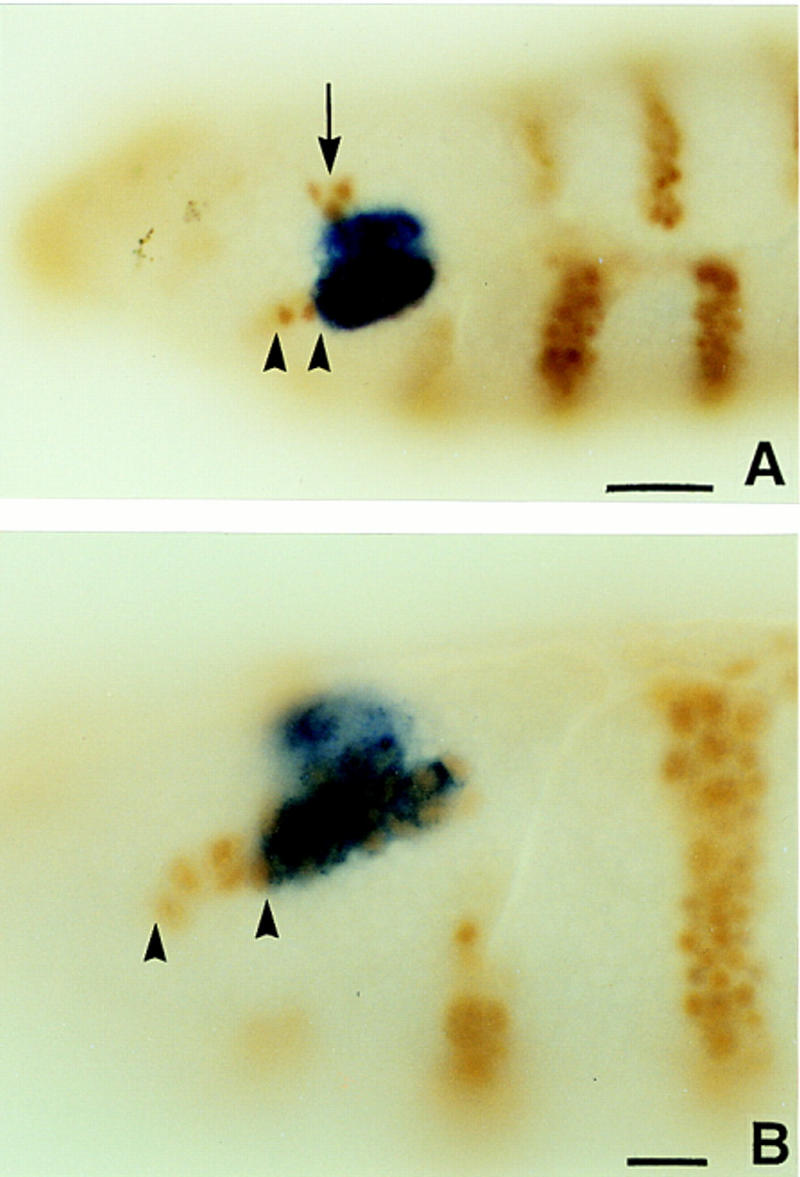
ss expression in the antennal segment of the embryo. (A,B) Wild-type embryos double labeled for ss transcript (blue) and en protein (brown). Note that the limits of ss expression extend from just ventral to the en head spot (arrow) through the antennal en stripe (arrowheads). The most ventral cells of the latter do not express ss. Scale bar in A, 20 μm; in B, 10 μm.