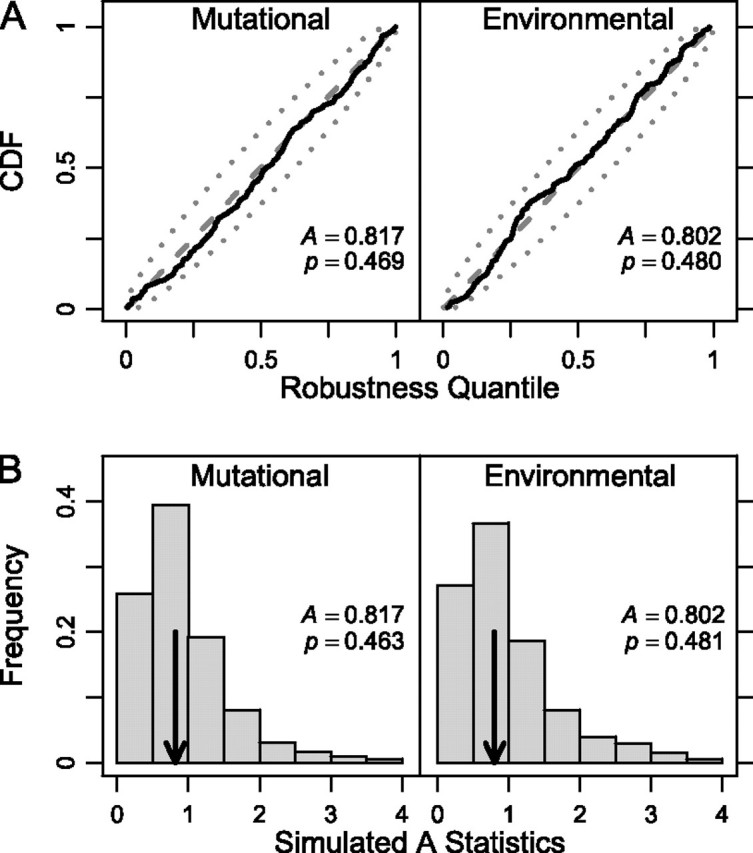
FIG. 4.

Neutral evolution of robustness. (A) The CDF of q values (black lines) of the robustness of pre-miRNAs compared with their corresponding structure-constrained null distributions. Anderson-Darling test statistics (A) and their associated P values are also shown. The dashed lines represent the expected values of points in a CDF for a uniform distribution, and dotted lines mark 95% concentration bands (only 5% of uniform CDFs of this size are expected to have at least one point outside this region). (B) Histograms of the simulated distributions for each A statistic; P values do not change noticeably.
