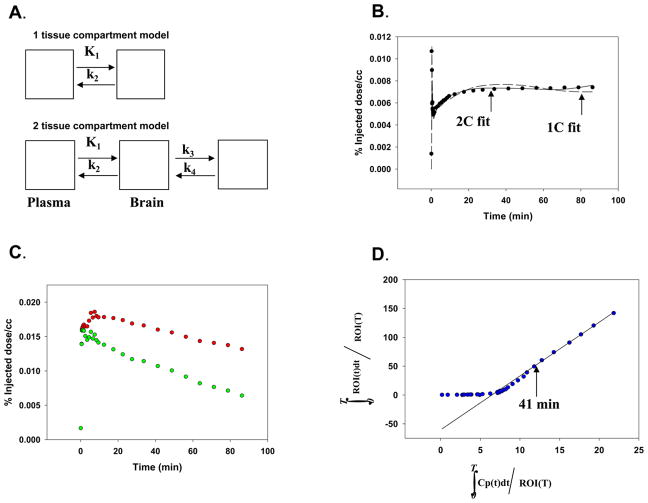
Figure 2. Quantification of HDAC activity.
A. Models tested for uptake (both a 1 and 2 compartment model (1C) and (2C) were used to fit uptake of [18F]FAC).
B. Comparison of model fits to uptake [18F]FAC data using the 1C and 2C models.
C. Uptake in thalamus with (upper curve) and without (lower curve) [18F]FAC from plasma for one animal.
The upper curve is the radioactivity in the thalamus ROI in a baseline [18F]FAHA study. The lower curve is the radioactivity remaining after the estimated contribution from plasma [18F]FAC has been subtracted using the model parameters from the 2C fit illustrated in Fig 2b.
D. Graphical analysis of lower curve in Fig 2C.
The total distribution volume of the corrected thalamus ROI (lower curve in Fig 2c) is the slope of the line from the point labeled 41 min. Vd = 10.9 ml/min/cc.

