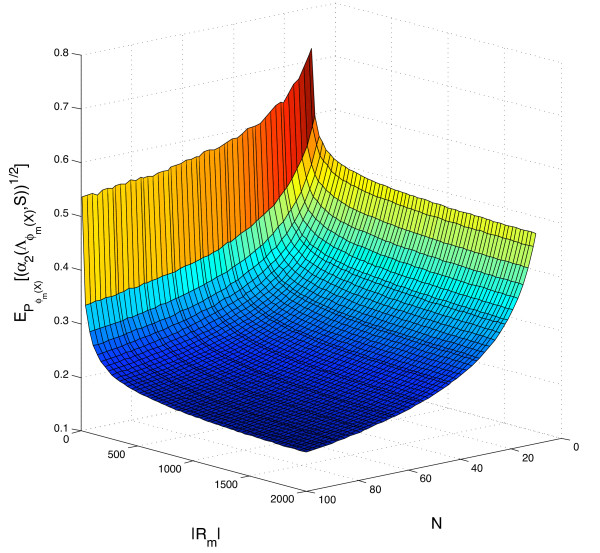
Figure 7.
Estimation of  . The figure shows
  with S = {1, 2}, for different choices of |Rm| and N, when the null distribution
  is defined by assuming that the matrix elements are drawn independently from
  . Red values correspond to high values of
  , while blue values correspond to low values of this statistic.

