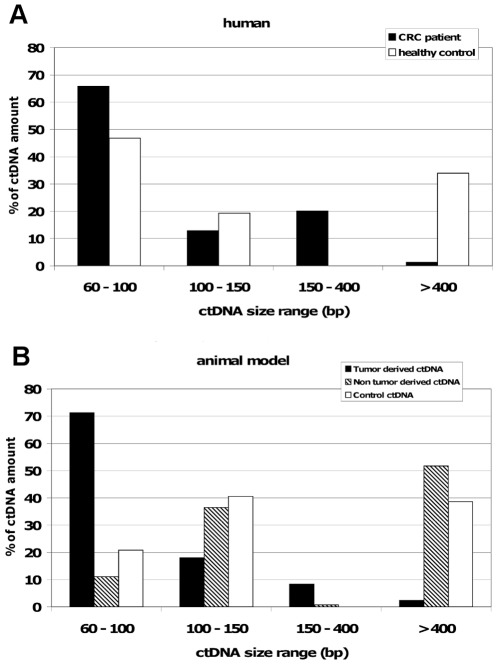
Figure 5. Comparison of the fractional fragment size distribution of ctDNA from clinical samples and from the animal model.
CRC and healthy patients (A) and tumour and non-tumour ctDNA in xenografted mice and control ctDNA in non-xenografted mice (B). The estimated amount of each ctDNA fraction was expressed as the percentage to the total ctDNA amount estimated as the sum of the ctDNA amount of the four size fractions. Data were calculated from the experiments presented in Table 1, Fig. 3 (mouse plasma samples) and Fig. 4 (human plasma samples).

