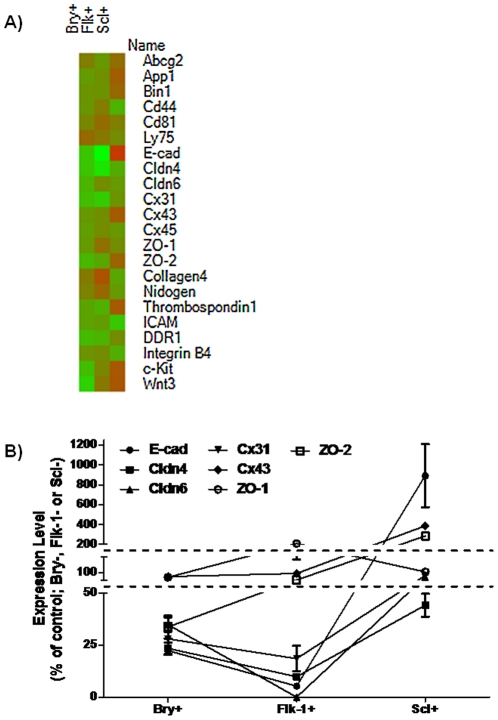
Figure 2. AM are differentially expressed in early hematopoietic and endothelial subpopulations of developing EB.
Quantitative analysis of gene expression was performed on populations of ESC differentiated in EB. Cells were sorted by FACS based on expression of Bry for mesodermal commitment, Flk-1 for hematopoietic and endothelial precursors and Scl for early hematopoietic cells. RNA was extracted and quantitative RT-PCR was performed. A) 21 genes were analyzed. Heat map was generated with Heatmap Builder (http://ashleylab.stanford.edu/tools_scripts.html). B) Samples are normalized to GAPDH and relative quantification is reported as percent of control (expression from sorted cell populations negative for expression of Bry, Flk-1 and Scl, respectively). Dashed line represents 2-fold increase/decrease in transcript expression level. (n = 3 for each sample; error bars represent standard deviation).

