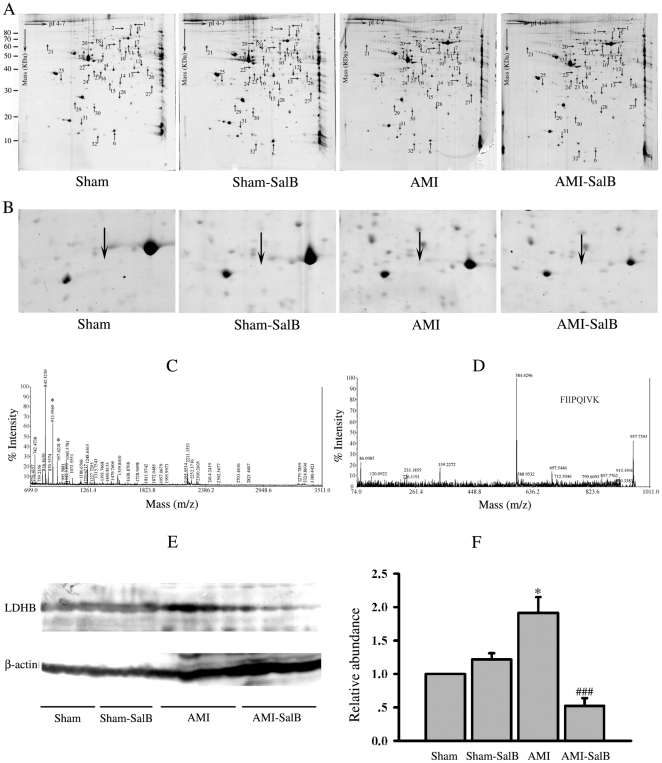
Figure 4. Differentially expressed proteins resolved by 2-DE analysis, identified by MS and Western blot.
(A) Representative 2-DE gel images from Sham, Sham-SalB, AMI and AMI-SalB. Differentially expressed spots chosen for further MALDI-TOF MS/MS analysis were indicated by arrows. n = 6 for every group. (B) Close-up image of protein spot 4 on different treatments. (C) MALDI-TOF MS/MS spectra of the spot 4 cut from the 2-DE gel resulted in the identification of LDHB. (D) MS/MS profile of the peptide with a mass of 957.6 Da from spot 4. (E) Western blot of LDHB in different treatments, one lane represents one rat. n = 10 for every group. (F) Quantitative data of LDHB for Western blot. *p<0.05 versus Sham; ###p<0.01 versus AMI. n = 10 for each group. At least three time experiments were repeated and the representative figures were shown.

