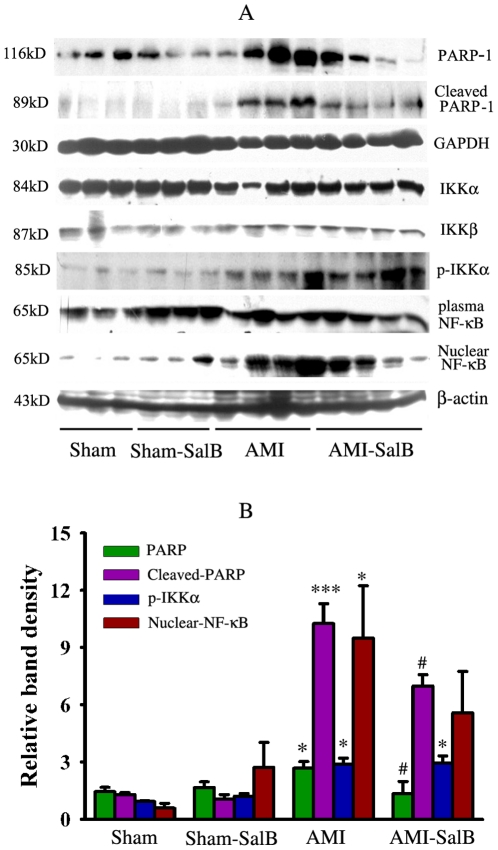
Figure 7. Regulation of SalB on the protein expression of PARP-1 an NF-kB signal pathway.
(A) Representative micrograph of Western blot for PARP-1, cleaved-PARP-1, IKKα, IKKβ, p-IKKα, plasma NF-κB, nuclear NF-κB. (B) Quantitative data of Western blot for relative proteins. *p<0.05, ***p<0.001 compared with Sham, #p<0.05 compared with AMI. n = 10 for each group. At least three time experiments were repeated and the representative figures were shown.

