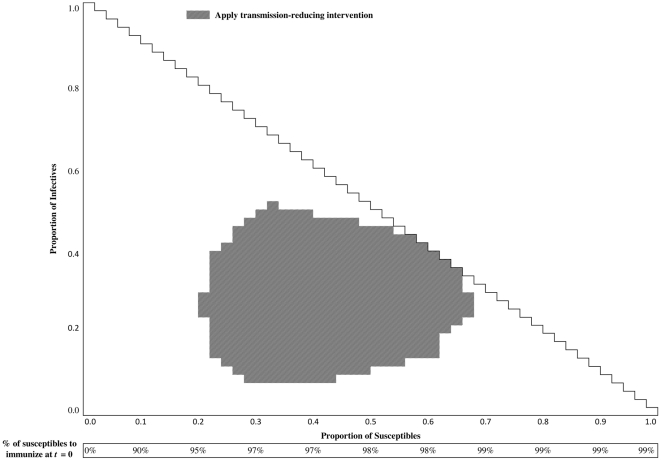
Figure 2. Optimal stationary health policy for  $.,25000/QALY.
The conditions for recommending the use of the transmission-reducing intervention is presented within the triangle in the upper part of each figure. In disease states consistent with those that are captured within the grey cells, the intervention should be used. For instance, the transmission-reducing intervention should be implemented if the state of the disease is  , and should not be used when the state of the disease is
  . The rectangle in bottom of this figure, labeled as “% of susceptibles to immunize at
  ,” represents the optimal health policies for immunization before the start of epidemic given that vaccine is available at a market price.

