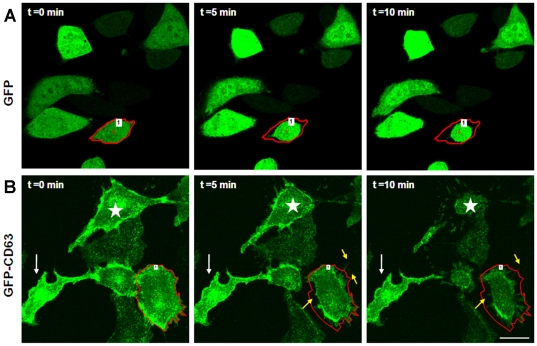
Figure 2. Visualization in real time of cellular detachment-induced rapid release of exosomes from BT-CD63 cells.
BT-CD63 cells or GFP expressing control cells were plated on MatTek glass dishes for 24 hours. Prior to live-cell imaging cells were washed 2 times in PBS. Cells were then treated with EDTA (2 mM) and the trafficking and release of GFP-labeled exosomes was monitored by time-lapse imaging for up to 10 minutes. Upper panels are representative individual frames from time-lapse acquired images of GFP expressing control cells. Lower panels are representative individual frames tracking the release of the GFP-tagged CD63 vesicles. The white arrow shows a strongly adhered cell that was not detached even after 10 minutes following EDTA addition. The yellow arrows indicate stream of GFP-tagged CD63 vesicles that are being released (see movie S1 and S2 in supplemental materials). Bar is 20 µm.

