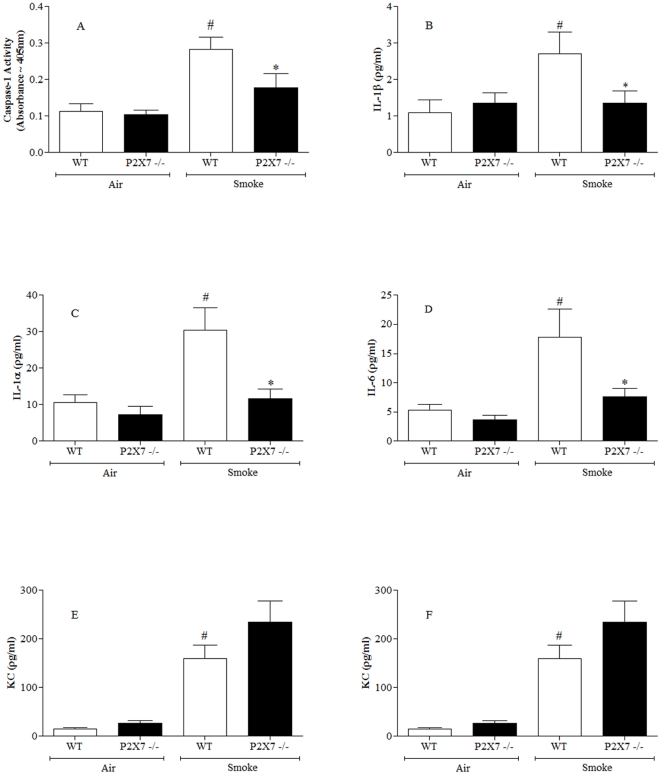
Figure 4. Role of the P2X7 – NLRP3 inflammasome axis in the CS driven murine model.
Wild type or P2X7 knockout mice were challenged with air or CS and samples collected 24 hours after the last challenge. (A) Caspase 1 activity in the lung tissue (B) IL-1β levels in the BALF (C) IL-1α levels in the BALF (D) IL-6 levels in the BALF (E) KC levels in the BALF (F) numbers of neutrophils in the BALF. Data represent mean ± s.e.mean, n = 8. # indicates statistically significant difference from air challenge control group. * indicates statistically significant difference from CS challenged control group (Mann-Whitney test).

