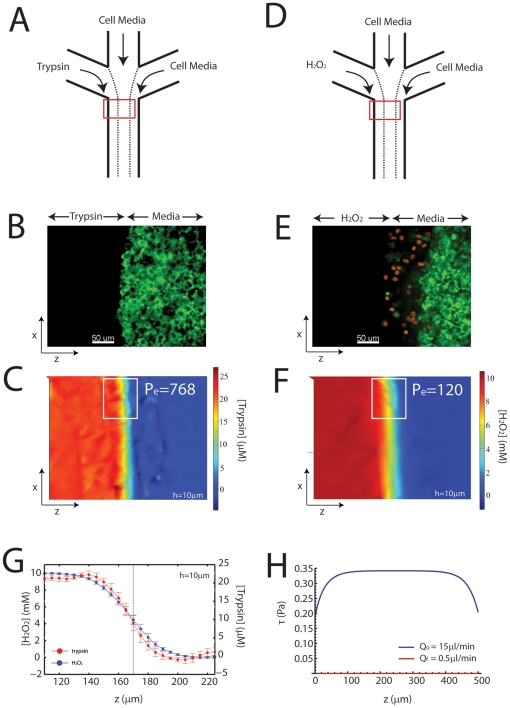
Figure 2. Composition of a Reconstituted Wound.
(A) Schematic of Experimental Setup in (B) and (C). Cell media and trypsin merge to selectively cleave cells from a confluent epithelial sheet. (B) A gradient in trypsin (0.05% or 21.4 M) denudes the cell sheet, leaving cells viable as shown by a live stain (green). (C) Two-dimensional plot of trypsin concentration during denudation. The flow,
  , is 15
 l/min for an average of 5 min. The diffusion coefficient for trypsin,
  = 2.1
= 2.1 m
m /s was estimated with a molecular radius of 1.5 nm [50]. The white box refers to the region which is averaged to see a line plot perpendicular to the direction of flow in (G). (D) Schematic of the Experimental Setup in (E) and (F).
  replaced trypsin after the cleavage of cells. (E) Delivery of
  (10mM) after trypsin treatment creates an apoptotic border (1-4 rows of cells), and immerses the rest of the sheet in a non-apoptotic concentration. Green: alive, red: dead. (F) Concentration profile of
  for
for  up to 15 min. The diffusion coefficient for
  ,
,  m
m /s was taken at 25C [51]. This diffusivity creates a larger mixing zone than the mixing zone for trypsin. The white box refers to the line plot in (G). (G) Line plot of trypsin and peroxide concentrations averaged over the x dimension in parts (C) and (F). The calculation is taken 10
  m from the coverslip, to approximate the concentration at the apical surface of the cells. (F) Shear calculation across the width of the channel (z) for the initial flow,
  , used for delivery of trypsin and
  , and final flow of pure media (no trypsin or peroxide) at
  = 0.5
= 0.5 l/min. The
  is maximum in the center of the channel, and equals 0.35 Pa for
  , and 0.001 Pa for
  .
.

