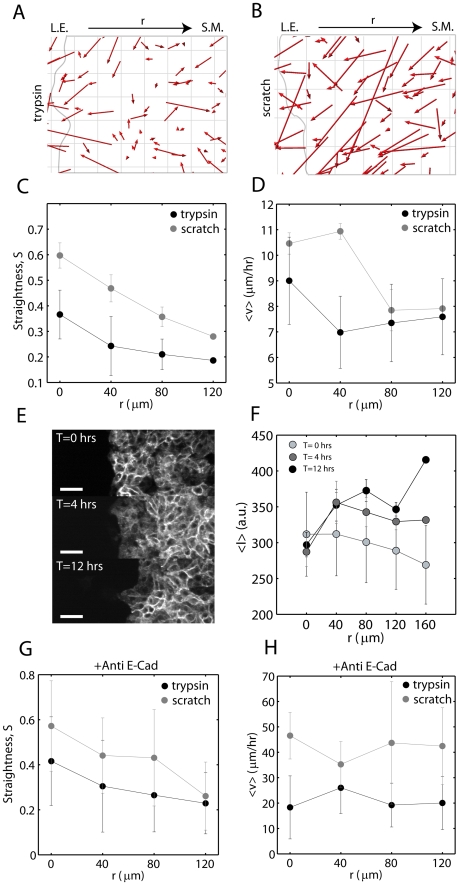
Figure 6. Velocity and Persistence are Hindered in the Submarginal Region of Enzymatically Denuded Sheets.
Displacement Vectors (by cell tracking) for sheets after enzymatic (A) or scratched (B) denudations (red arrows). L.E.: leading edge, S.M.: submarginal cells. The leading edge is hand drawn in gray. Grid size is 20  m. Straightness (C) and Speed (D) of cell movement as a function of distance from the (initial) leading edge,
  (N = 6). (E) Immunostaining of E-cadherin at T = 0, 4, and 12 hours post cleavage (N = 3). Scale bar is 50
 m. (F) Fluorescence intensity as a function of
  . Straightness (G) and Speed (H) as a function of
  for sheets blocked with 200
 g of anti-E-cadherin antibody (N = 2).

