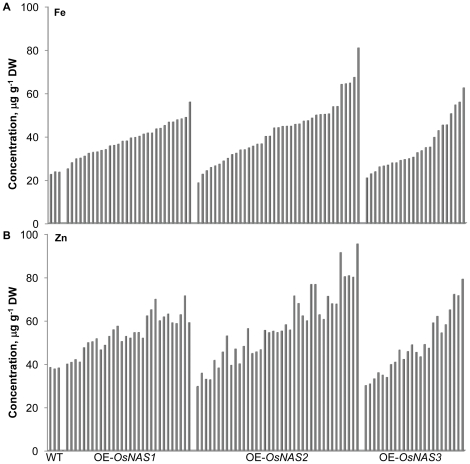
Figure 2. Fe (A) and Zn (B) concentrations in unpolished grain of wild type and transgenic rice.
WT, three wild type lines of rice; OE-OsNAS1, 30 independent transgenic lines overexpressing OsNAS1; OE-OsNAS2, 39 independent transgenic lines overexpressing OsNAS2; OE-OsNAS3, 24 independent transgenic lines overexpressing OsNAS3. Unpolished grain was analyzed by ICP-OES to determine Fe and Zn concentrations. The three populations of overexpression lines are sorted in order from lowest to highest Fe concentration in panels A and B.

