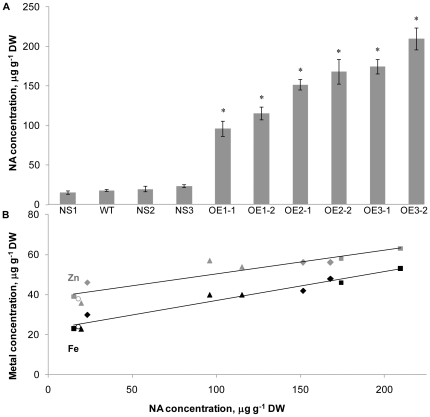
Figure 3. Fe and Zn concentrations in unpolished grain are positively correlated with nicotianamine (NA) concentration.
(A) NS, null segregant lines of rice; WT, wild type line of rice; OE, overexpression lines of rice. Three sibling T1 lines, consisting of two OE lines and one NS line, were obtained from a single-insert T0 mother line in each of the three OsNAS overexpression populations. The three OsNAS1 sibling lines are labeled OE1-1, OE1-2 and NS1; the three OsNAS2 sibling lines are labeled OE2-1, OE2-2 and NS2; the three OsNAS3 sibling lines are labeled OE3-1, OE3-2 and NS3. Unpolished grain was analyzed by LC-MS to determine nicotianamine concentration (mean ± SE, n = 4). Significant differences from WT were determined by Student's t test and are indicated by asterisks (P<0.05). (B) Statistically significant positive correlations were found between unpolished grain NA concentration and Fe (black shapes; r = 0.9769 and p<0.01) and Zn (gray shapes; r = 0.9288 and P<0.01) concentrations for the ten genotypes described in panel A. The six OE1, OE2 and OE3 sibling lines are represented by triangles, diamonds and squares, respectively. The three NS lines appear just next to the WT line (represented by circles) on the scatter chart.

