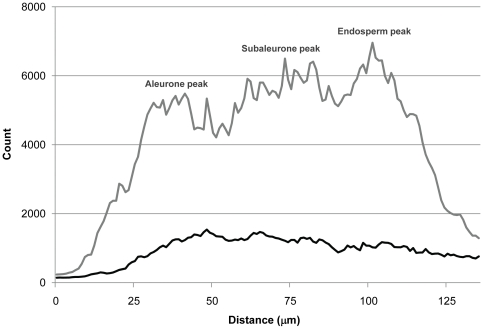
Figure 6. Line scans for Fe in WT and OE-OsNAS2A grain.
Line scans begin on the outer margin of grain and continue 135 µm towards the endosperm; average WT counts indicated by the black line and average OE-OsNAS2 counts indicated by the gray line (mean, n = 23). The location of the successively higher Fe peaks in aleurone, subaleurone and endosperm regions of OE-OsNAS2A grain is indicated on the figure.

