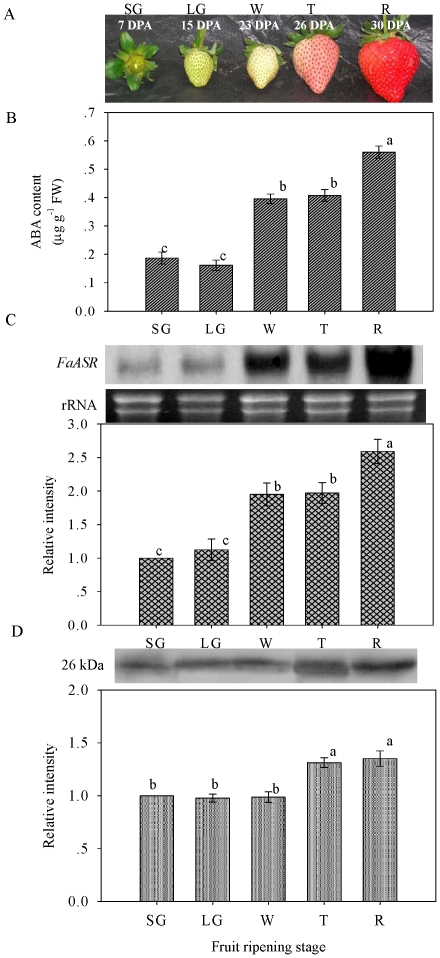
Figure 6. Photograph of fruits representative of each stage (A), SG: small green; LG: large green; W: white; T: turning, 50% red and R: full-ripe red, and changes of endogenous ABA content (B), levels of FaASR mRNA (C) and protein (D) at different fruit ripening stages.
In (A), each stage of fruit development corresponded to days after post-anthesis (DPA) were indicated. In (C), total RNA (10 μg per lane) was used for northern blot analysis and hybridized with DIG-labeled probe, and ethidium bromide-stained rRNA was shown as the loading control. In (D), equal amounts of protein (30 μg) per lane were subjected to SDS-PAGE and then transferred to a nitrocellulose membrane. Thereafter, the FaASR protein amount was immunodetected by western blot using the anti-FaASR specific polyclonal antibody. In (C) and (D), the quantification of the northern or western blot bands was expressed in relation to the amount in fruit sampled at SG, which was set to 1. In (B), (C) and (D), vertical bars represented standard deviations (SD) of means (n = 3). Different letters indicated a statistical difference at the 5% level among data groups according to the Duncan's multiple range test.

