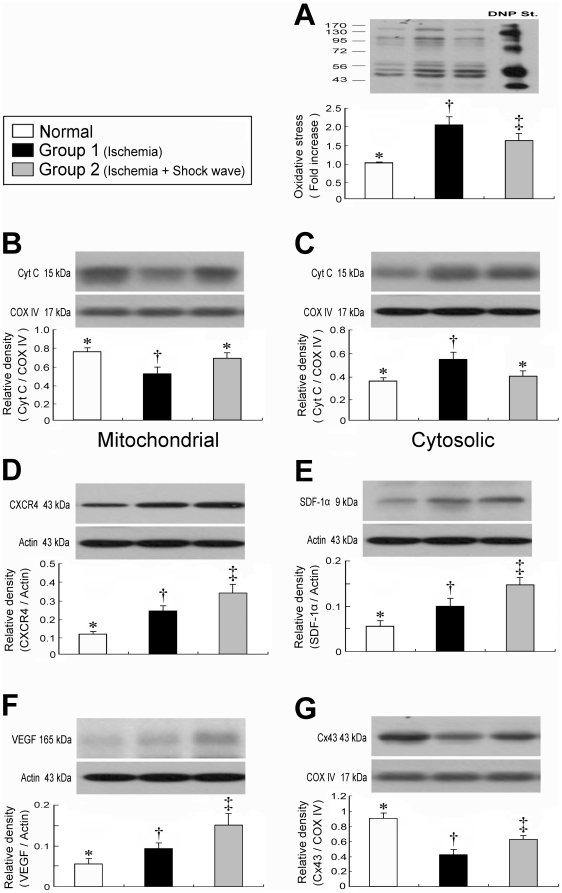
Figure 2. Expression of oxidative stress- and angiogenesis-related proteins in LV myocardium.
A) Protein expression of oxidative stress. †p<0.001 between the indicated groups. B) Protein expression of cytochrome C in mitochondrial level. †p<0.04 between the indicated groups. C) Protein expression of cytochrome C in cytosolic level. †p<0.04 between the indicated groups. D) Protein expression of CXCR4. †p<0.03 between the indicated groups. E) Protein expression of stromal cell-derived factor (SDF)-1α. †p<0.05 between the indicated groups. F) Protein expression of VEGF. †p<0.03 between the indicated groups. G) Protein expression of connexin43 (Cx43). †p<0.005 between the indicated groups. Symbols (*, †, ‡) indicate significance (at 0.05 level) (by one-way ANOVA and Bonferroni multiple comparison post hoc test, n = 6 in each group).

