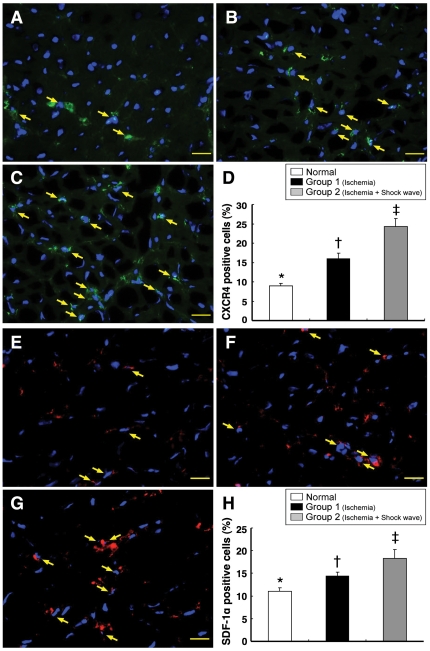
Figure 5. Immunofluorescent staining of CXCR4 and SDF-1α in LV myocardium.
Upper Panel: Immunofluorescence staining (400x) showing significantly lower number of CXCR4-positive cells (yellow arrows) in normal controls (A) than in ischemic animals without (B) and with (C) shock wave treatment. *p<0.01 between the indicated groups (D). Scale bars in right lower corner represent 20 µm. Lower Panel: Immunofluorescence staining (400x) showing significantly lower number of SDF-1α-positive cells (yellow arrows) in normal controls (E) compared with animals after ischemia without (F) and with (G) shock wave treatment. *p<0.01 between the indicated groups (H). Scale bars in right lower corner represent 20 µm.

