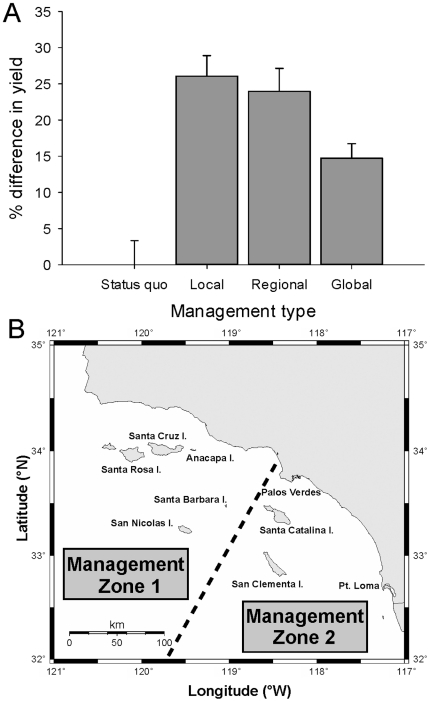
Figure 9. Percent change in yield for the whole California sheephead fishery under four management scenarios.
Status quo reflects model output given the current size limit and fishing mortality rates. Local management reflects separate size limits and fishing mortality rates tuned to each population (see Table 2c; Fig. 8a). Regional management assumes two separate stocks with different regulations in the northern and southern regions (see Table 2d). Global management assumes one stock and finds a new optimal size limit and fishing mortality rate while meeting sustainability criteria (see Table 2). Shown are mean cumulative increases in potential fishery yield ±1 SE from 1,000 simulations of the fishery model. (B) Suggested demarcation of two separate California sheephead management zones in southern California according to the grouping of sites that maximizes yield under the ‘Regional Management’ framework.

