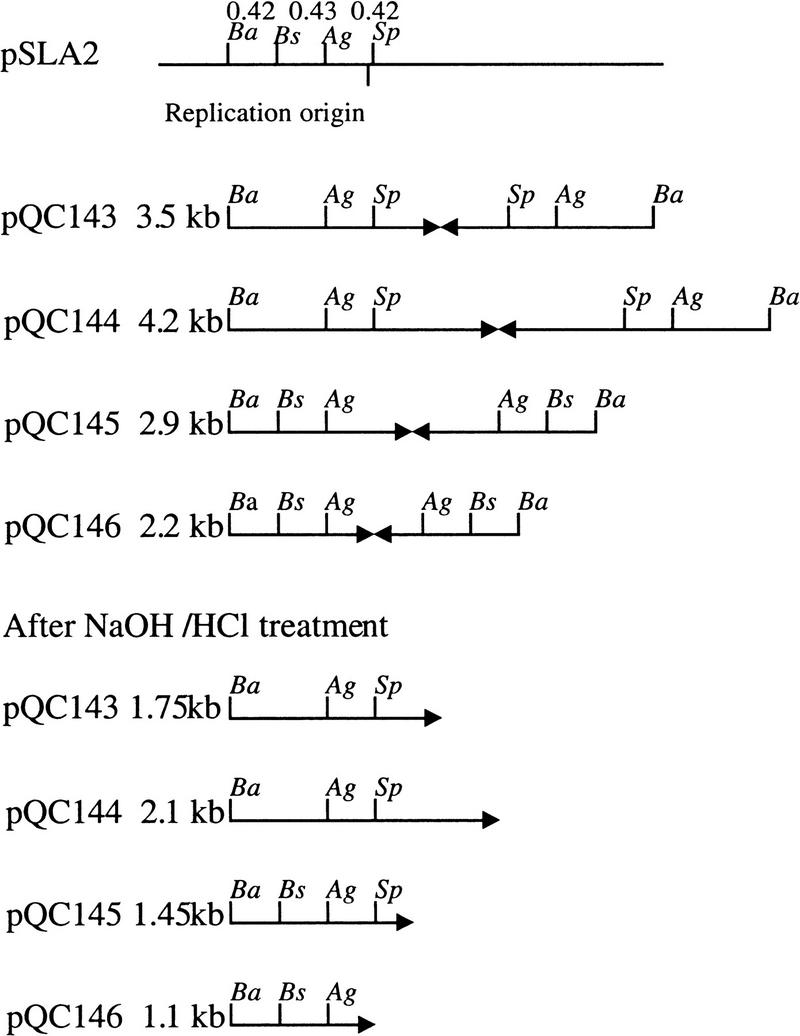
Figure 3.
Diagrammatic interpretation of enzyme digestion pattern in Figure 2G. The apices of long palindromes are shown by pairs of arrows. Cleavage sites are (Ba) BamHI; (Ag) AgeI; (Sp) SphI; (Bs) BstXI. The sizes determined for BamHI fragments determined by gel migration prior to or following denaturation/renaturation are shown for each plasmid. A restriction map of the replication origin region is shown at the top.

