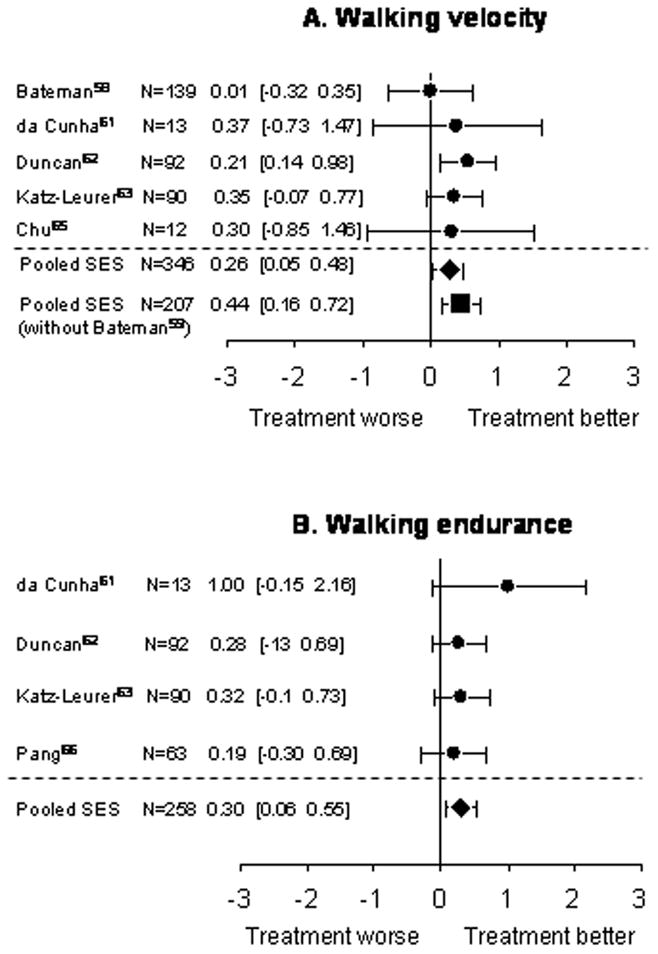
Figure 2.

Meta-analysis: walking performance. Each set of dot (●) and error bars represent the standardized effect size (SES) and its 95% confidence interval (CI), respectively, for each study. The first author, the number of subjects involved, the SES value and its 95% CI of each study were also indicated beside each respective set of dot and error bars. The pooled SES was indicated by ◆ (all studies) and ■ (without Bateman et al. 200159).
