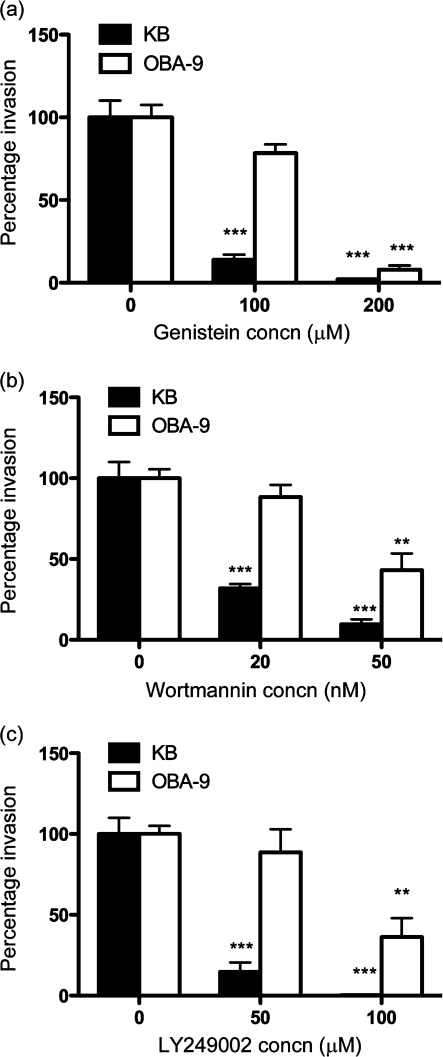
Fig. 1.
Invasion assay with (a) genistein-, (b) wortmannin- and (c) LY249002-treated KB and OBA-9 cells. Values are expressed as a percentage of the bacterial invasion of non-treated cells (designated 100 %). Results are means and sds of three independent experiments each with triplicate measurements. ** and *** indicate P<0.01 and P<0.001, respectively, relative to untreated cells.

