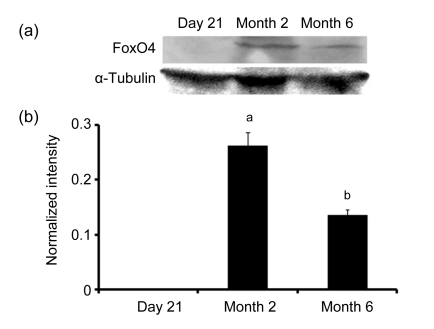
Fig. 3.
Western blotting (a) and digital image analysis (b) of FoxO4 in the duodenum of rats at 21 d, 2 and 6 months old
After homogenization, the extracted duodenal mucosas (40 µg/lane) were fractionated on sodium dodecyl sulfate polyacrylamide gel electrophoresis (SDS-PAGE) gels and transferred to nitrocellulose, then followed by immunoblot analysis of FoxO4. For the control, immunoblot analysis was performed with antibodies specific to α-tubulin. Then, following immunoblot analysis, the intensities of FoxO4 immunoreactive bands were determined by digital image analysis. Data (ratio to α-tubulin) represent means±SEM. Different letters above the bars indicate a statistically significant difference (P<0.05, n=6) among groups

