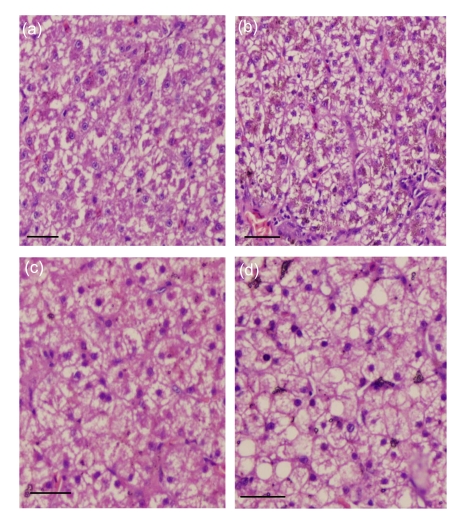
Fig. 1.
Representative microphotographs of a 6 µm-thick section of duck liver stained with hematoxylin-eosin (HE)
Ducks were fed a control diet (a), a 3% (w/w) FO diet (b), a 2.5% (w/w) SO diet (c), or a 5% (w/w) PBO diet (d). In (d), note the swollen hepatocytes with enlarged irregular nuclei located at the periphery of the cell. Bar=60 mm

