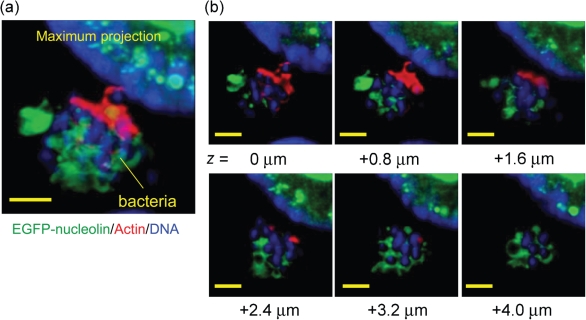
Fig. 2.
EPEC sequesters EGFP-nucleolin into its microcolonies. (a) High-resolution image showing bacterial microcolony associated with extensive EGFP-nucleolin at 120 min post-infection. (b) The bacterial microcolony in (a) was sectioned at 0.8 µm increments along the z axis and the images were deconvolved to reveal the EGFP-nucleolin pattern within the microcolony. Yellow scale bars, 3 µm.

